
Your First Pipeline
Goal: run a generated signal, inspect two transformations, and save a modified pipeline. You need a running MOSAIC application; no hardware is required. These steps describe the desktop workbench. On iOS, use the mobile file picker and controls instead of desktop menus.
For help locating the canvas, palette and block cards, see Using the Workbench.
1. Open the example
Choose File → Open or the folder button and open
Assets/Examples/SevenSteps/01_simple_example.json from the application's output folder.
The repository copy is under MOSAIC/MOSAIC/Assets/Examples/SevenSteps.
You should see four blocks and three connections:
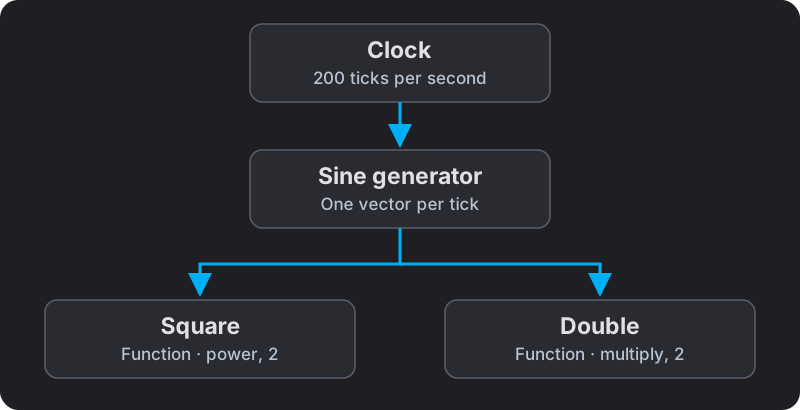
| Block name | What it does |
|---|---|
Clock |
Provides 200 ticks per second. |
sinusoidSignal |
Produces ten channels of sine waves. |
squaredSignal |
Squares each incoming value. |
doubledSignal |
Multiplies each incoming value by two. |
Loading constructs the graph. It does not press Play for you. Resolve any missing blocks or connections reported during loading before interpreting the output.
2. Start and inspect the signal
Open the block controls in the left panel, find the Clock card, and press Play. Open the sine generator's card and enable its Scope plot if hidden. Open the Function cards to compare their output. Plot visibility does not start or stop processing.
- The sine signal oscillates above and below zero.
- The squared signal is nonnegative.
- The doubled signal has twice the sine signal's amplitude.
The example uses the generator's default frequency of 0.2 Hz, so a full cycle takes five seconds. Allow enough time to see the shape. Multiple channels have phase offsets; select a single channel if overlapping traces make comparison difficult.
3. Change a parameter
Pause the Clock while editing. In the doubledSignal Function card, change the multiplier
from 2 to 3 and apply the setting if the control offers an Apply action. Resume the Clock.
The output should now reach three times the original amplitude.
The equivalent saved block definition is:
{
  "doubledSignal": {
    "Type": "Function",
    "Inputs": ["sinusoidSignal"],
    "Params": ["multiply", 3]
  }
}
This is a configuration fragment, requiring the named upstream block in the full pipeline.
4. Add and connect a block
Pause the Clock. Open the palette in the right panel and find Negate under Signal Processing. Drag it onto the canvas, give it a distinct name, and confirm its settings. It has no parameters and flips each value's sign.
In the graph's build mode, drag from the sine generator's output port at the bottom to Negate's input port at the top. A connection sends the source's output to the target. Moving a node changes its position, not its connections.
Watch the port-to-port connection demonstration if you are unsure where to drag.
Resume the Clock. Negate publishes the inverted vector and has no dedicated plotting card.
Inspect its output by recording it or connecting a compatible downstream
block. For a sine input of 0.5, expect -0.5 at Negate's output.
5. Save and reopen
Use File → Save As to save your own copy, then pause the Clock. Reopen that copy and check that your multiplier and Negate connection are present. Press Play again.
Saving stores configuration, not every live hardware connection, plot history, or trained model. See what saving preserves.
A smaller downloadable example
Download a complete single-channel pipeline. It explicitly sets a 1 Hz, amplitude-1 sine wave, so the squared output ranges from 0 to 1 and the doubled output from −2 to 2.
Continue
Continue with Signal Processing Walkthrough to filter a known signal, extract a feature, inspect a spectrum and record the result. Learn recording, inspect the configuration format, or choose an operation from the Block Catalogue. For a flat plot, see Troubleshooting.